In this post I take a look at the new September 2020 state-level employment data provided by the Bureau of Labor Statistics (BLS) and find a complex and tenuous jobs recovery in America. I share some of the most interesting numbers in original graphs.
In the graphs below I make use of the “trend line” feature introduced in my last post. These lines allow us to see how far away from a return to February 2020 employment levels the series (or grouping of series) may be. Please treat these lines with a grain of salt, as predicting what will actually happen in the coming months is virtually impossible. Still, if you see “NA” on an industry-level legend instead of a date value that means either that the industry growth is zero for that series or series group, or that it is moving away from the February 2020 employment values (you can usually tell which is which).
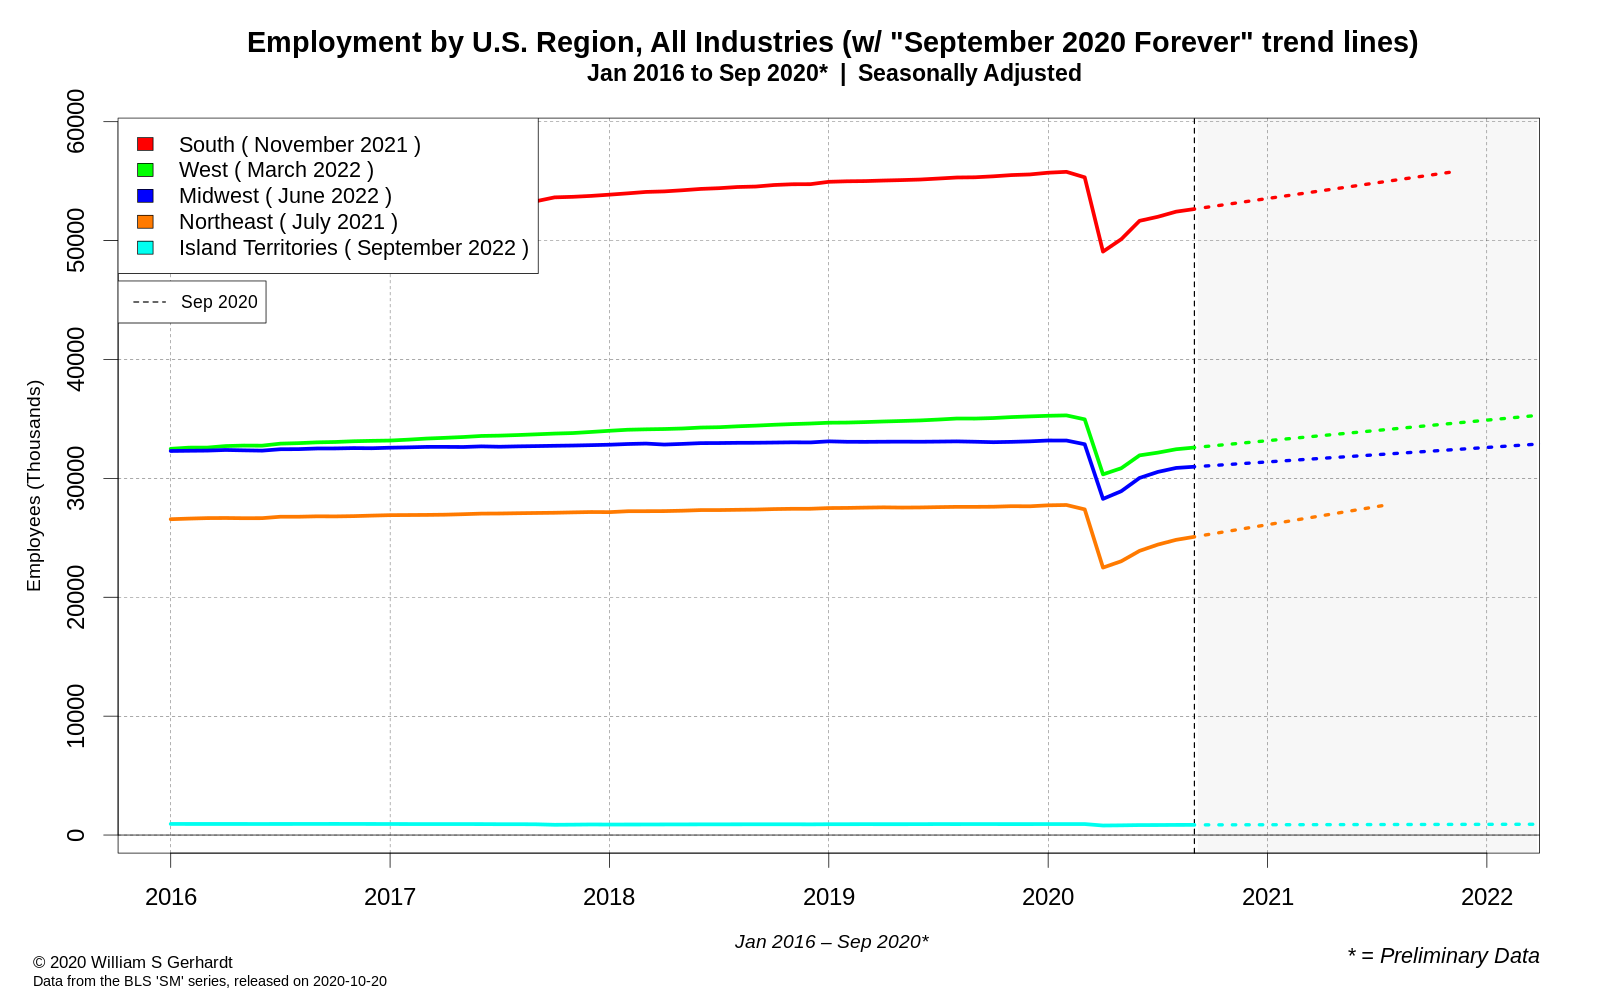
The Northeast “V” Recovery
On the surface, the region of the American Northeast appears to be on a healthy trajectory towards “recovered” employment. If the trend from preliminary September 2020 numbers continues, the Northeast could end up besting other regions in the United States on the path to February 2020 employment levels:
(Click any image on the page for a high res version)
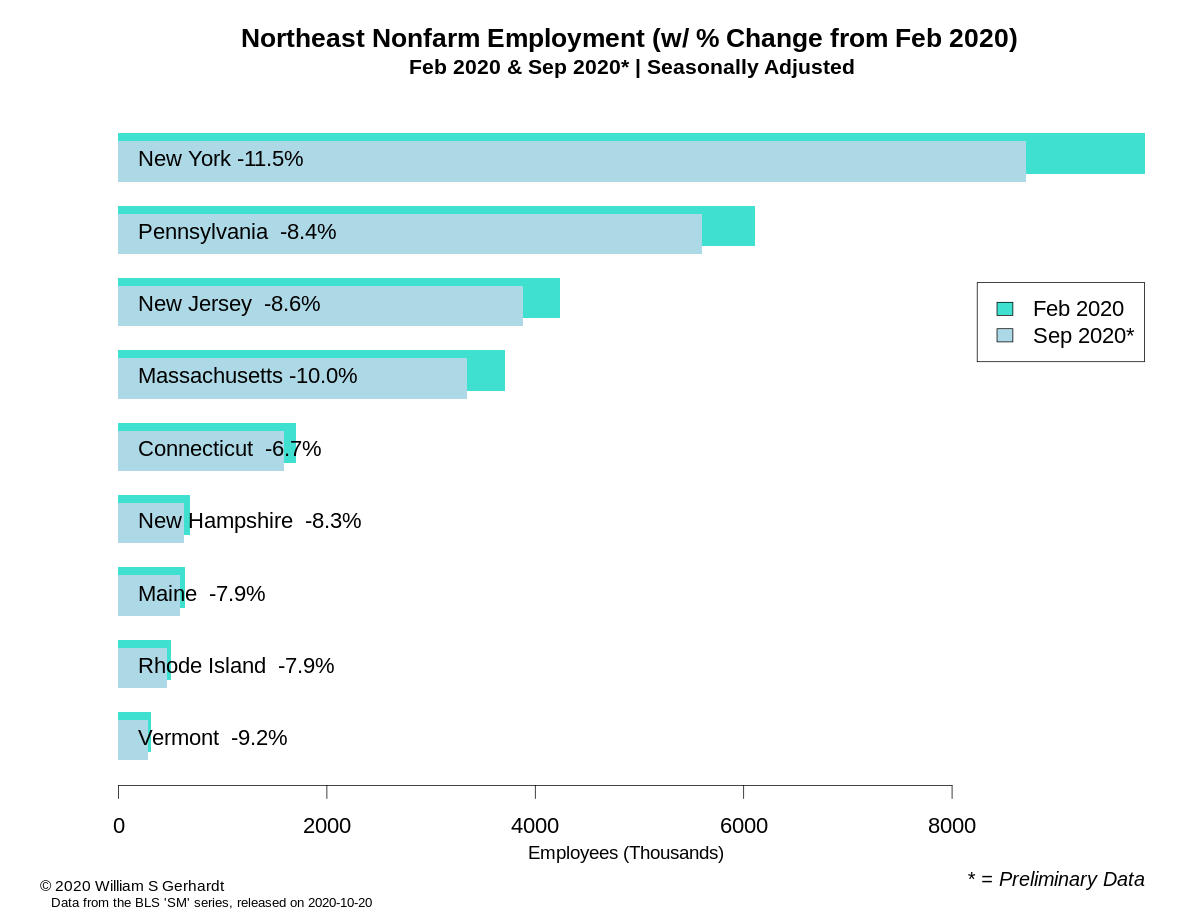
However, the Northeast is in a much less enviable position in the moment, especially when you compare the September 2020 employment numbers to how things were in February 2020:

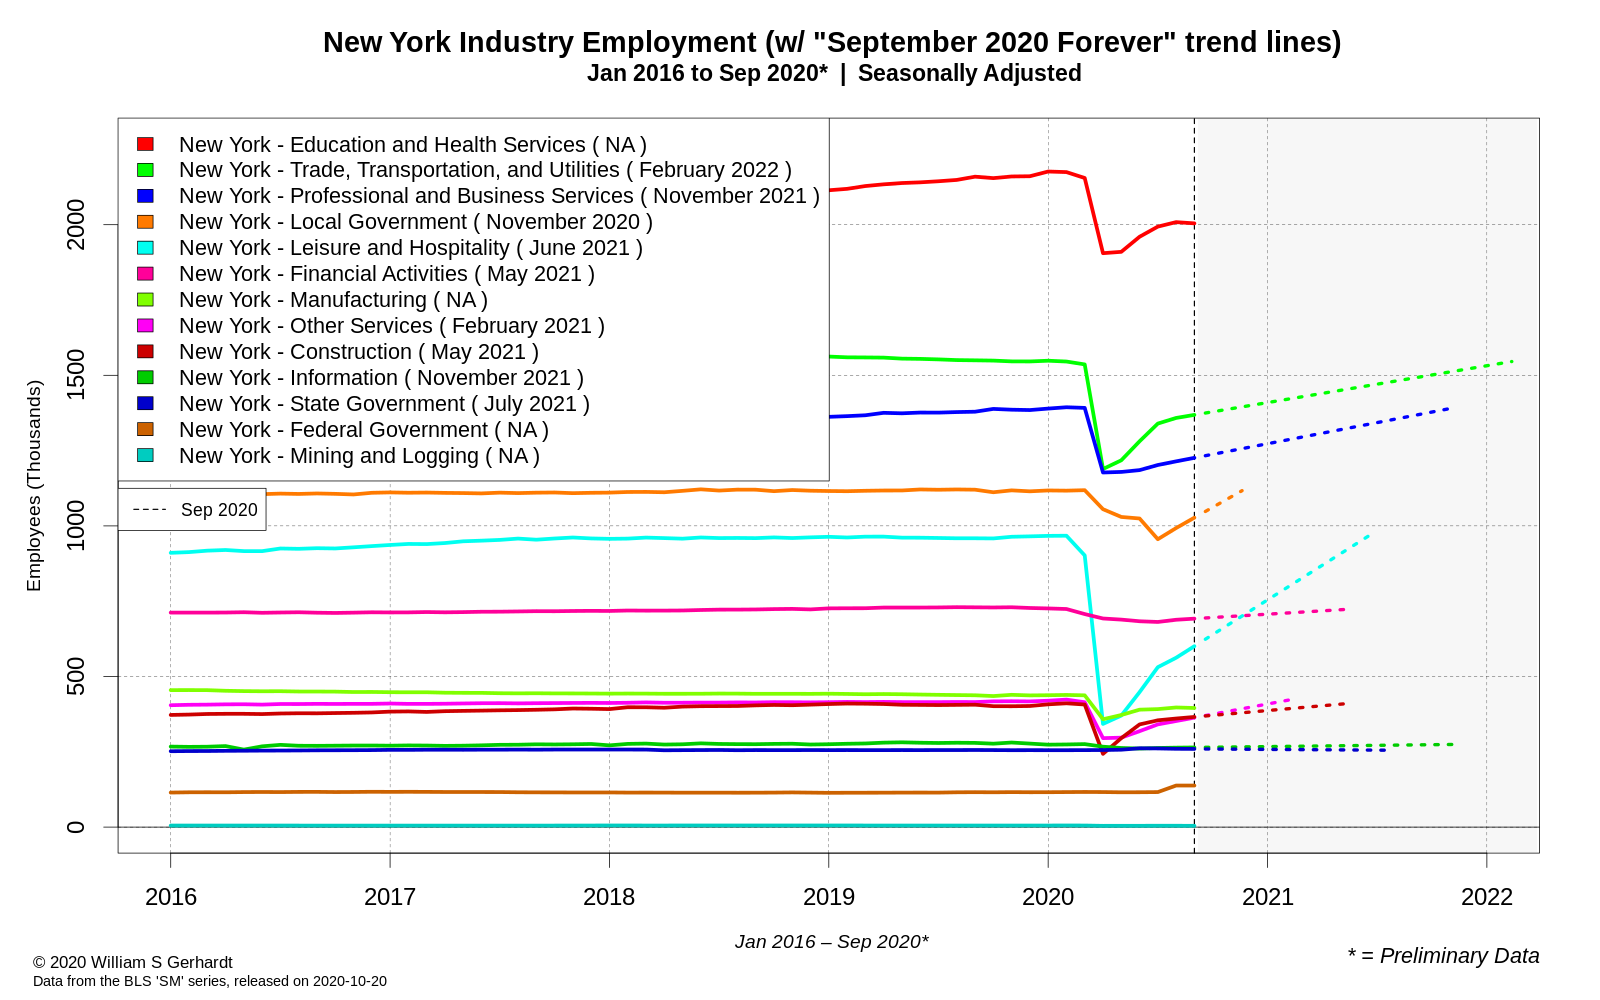
State-specific data shows that the situation is more complex than it appears on the surface, with different industries performing differently on a state-by-state level. To prove the point, this is what the numbers currently look like in New York, based on all major high-level industries groupings provided by the BLS:
(Click image for high res version)
Different industries naturally performed very differently in New York during the COVID-19 pandemic. Some sectors, like Local government, look like a deflated “W.” Others, like the top-employing Education and Health Services industry grouping, now appear to be taking a turn for the worse after a mild recovery. And while construction has recovered completely in some states (see the graphs for Kentucky further below) in New York this industry has yet to recover.
While overall not a single northeastern state had a net loss in jobs in September—according to preliminary BLS numbers for September—this cannot be said for any other United States census region, and outside the northeast there is a very mixed picture of pandemic-era employment.
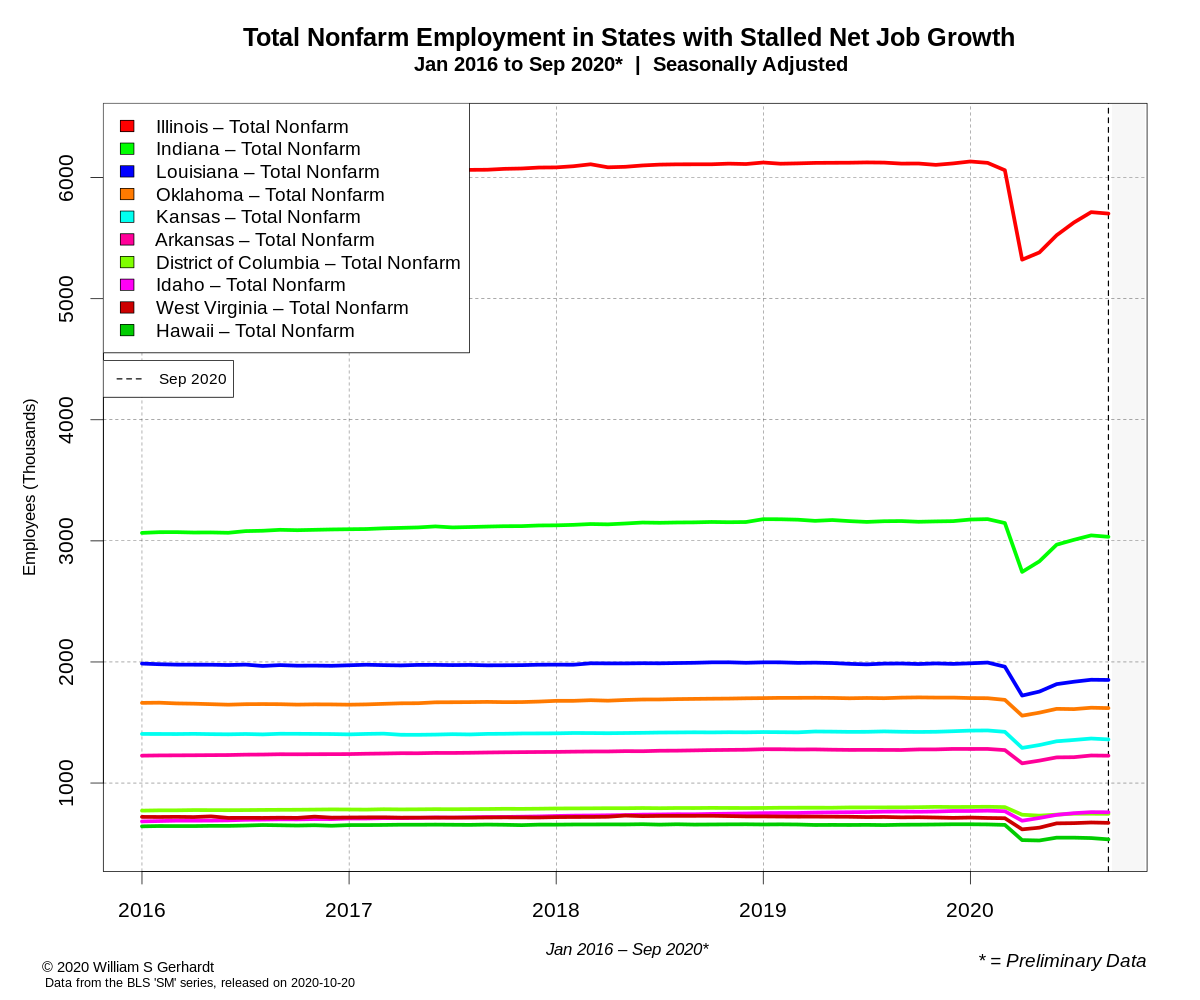
Some States Are Losing Net Jobs Again; Hawaii is Suffering the Most
Employment growth in September 2020 stalled or reversed direction in Illinois, Indiana, Kansas, Louisiana, Oklahoma, Arkansas, West Virgina, Idaho, Hawaii, and the District of Columbia (which is still not a state).
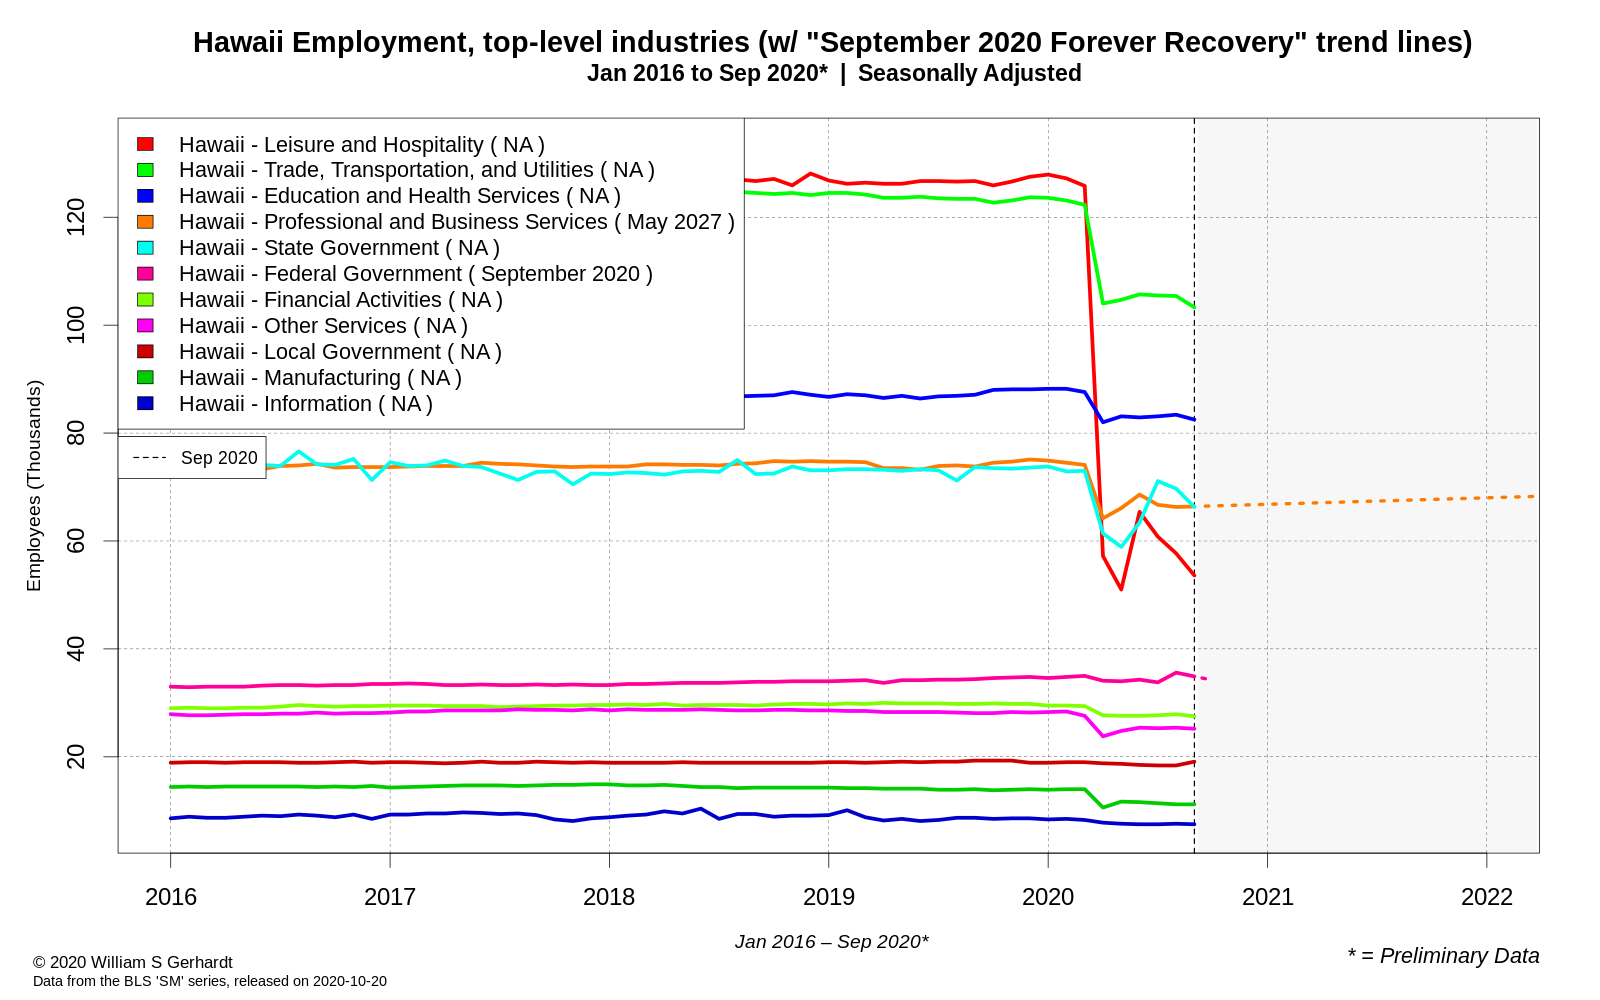
In this pack Hawaii is the black sheep, and Hawaii’s jobs numbers in September are trending downward at an alarming rate, with the State’s “Leisure and Hospitality” sector in something of a free fall (again):
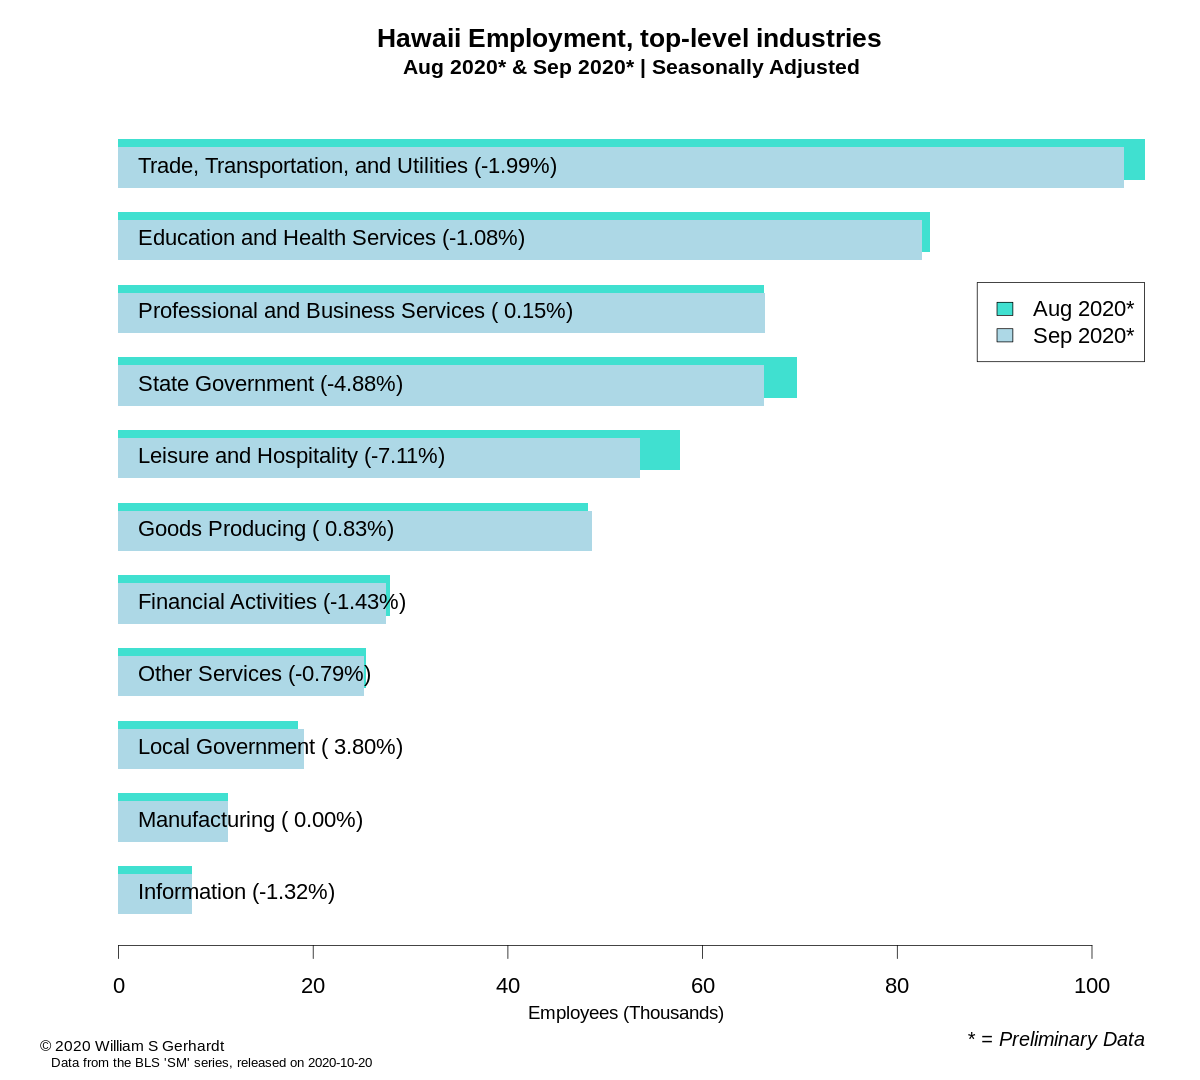
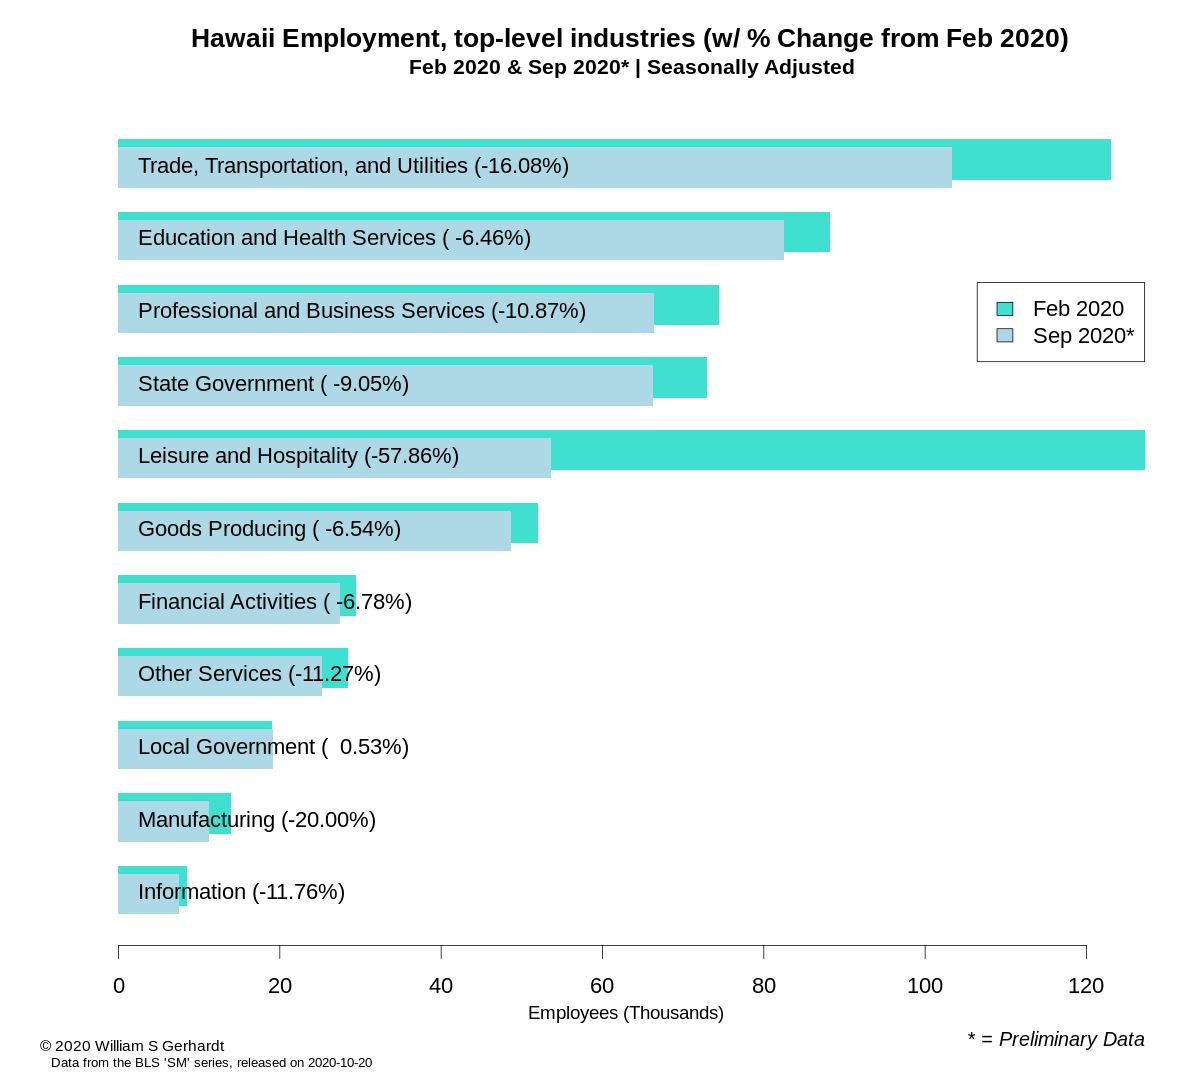
To emphasize just how bad things are for Hawaii, the two bar graphs below clearly show how things have changed between August and September, and February and September. As you can see, Hawaii’s Leisure and Hospitality Industry dropped by a seasonally adjusted 7% just last month…
… and Leisure and Hospitality is down 57% in employment since February:
What will happen to Hawaii if there is not a significant injection of new Federal economic aid? A better question may be: “Do we really want to find out?”
Midwestern Angst
Some states in the midwest took a downward turn in their job numbers last month, as news accounts reported that COVID-19 is taking hold across that region with a fury.

The numbers from Illinois specifically show that many industries appears to be on very shaky footing, based on their preliminary September 2020 employment levels:

It’s unclear if this is a single-month anomaly or an early sign of the kind of economic downward spiral some economists have feared would occur in the absence of new Federal stimulus. We will need more data (and time) to know for sure.
Kentucky Fried Jobs
Wrapping up the initial survey of the preliminary September 2020 state-level data I look at the crowded South:
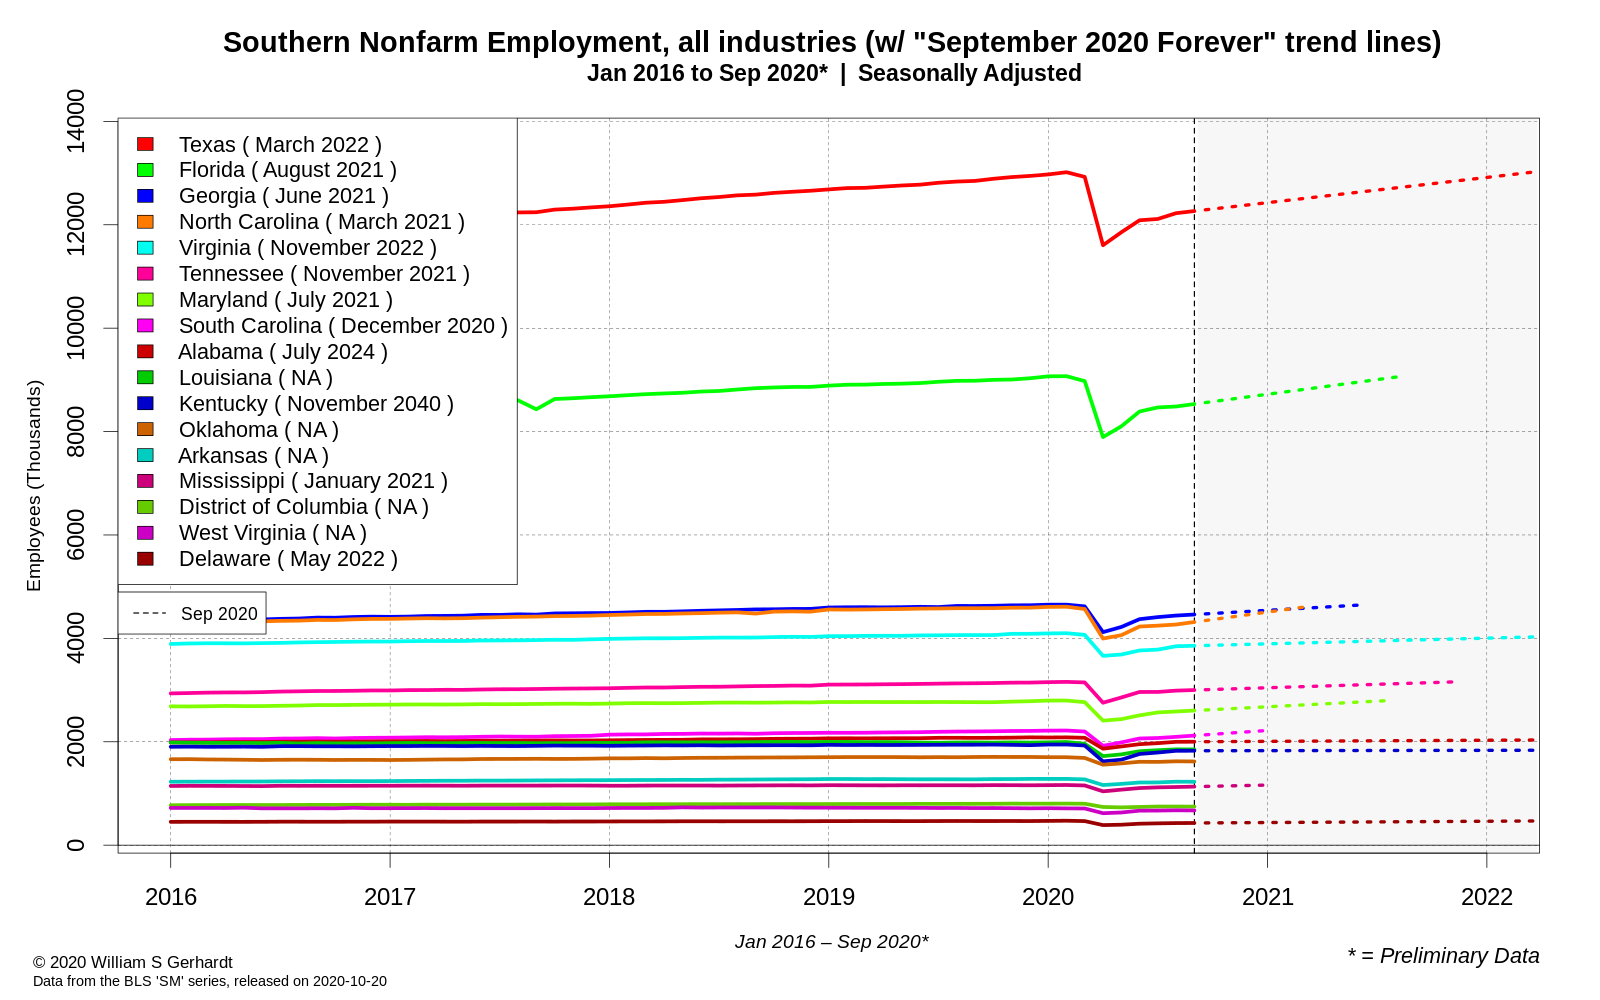
Notable on this list is the entertaining “September 2020 Forever” trend line for Kentucky which, at last month’s rate of growth, projects the state will return to February 2020 employment levels in… November 2040? This projection is shown to be absurd when you look at the industry-level employment data for the state:
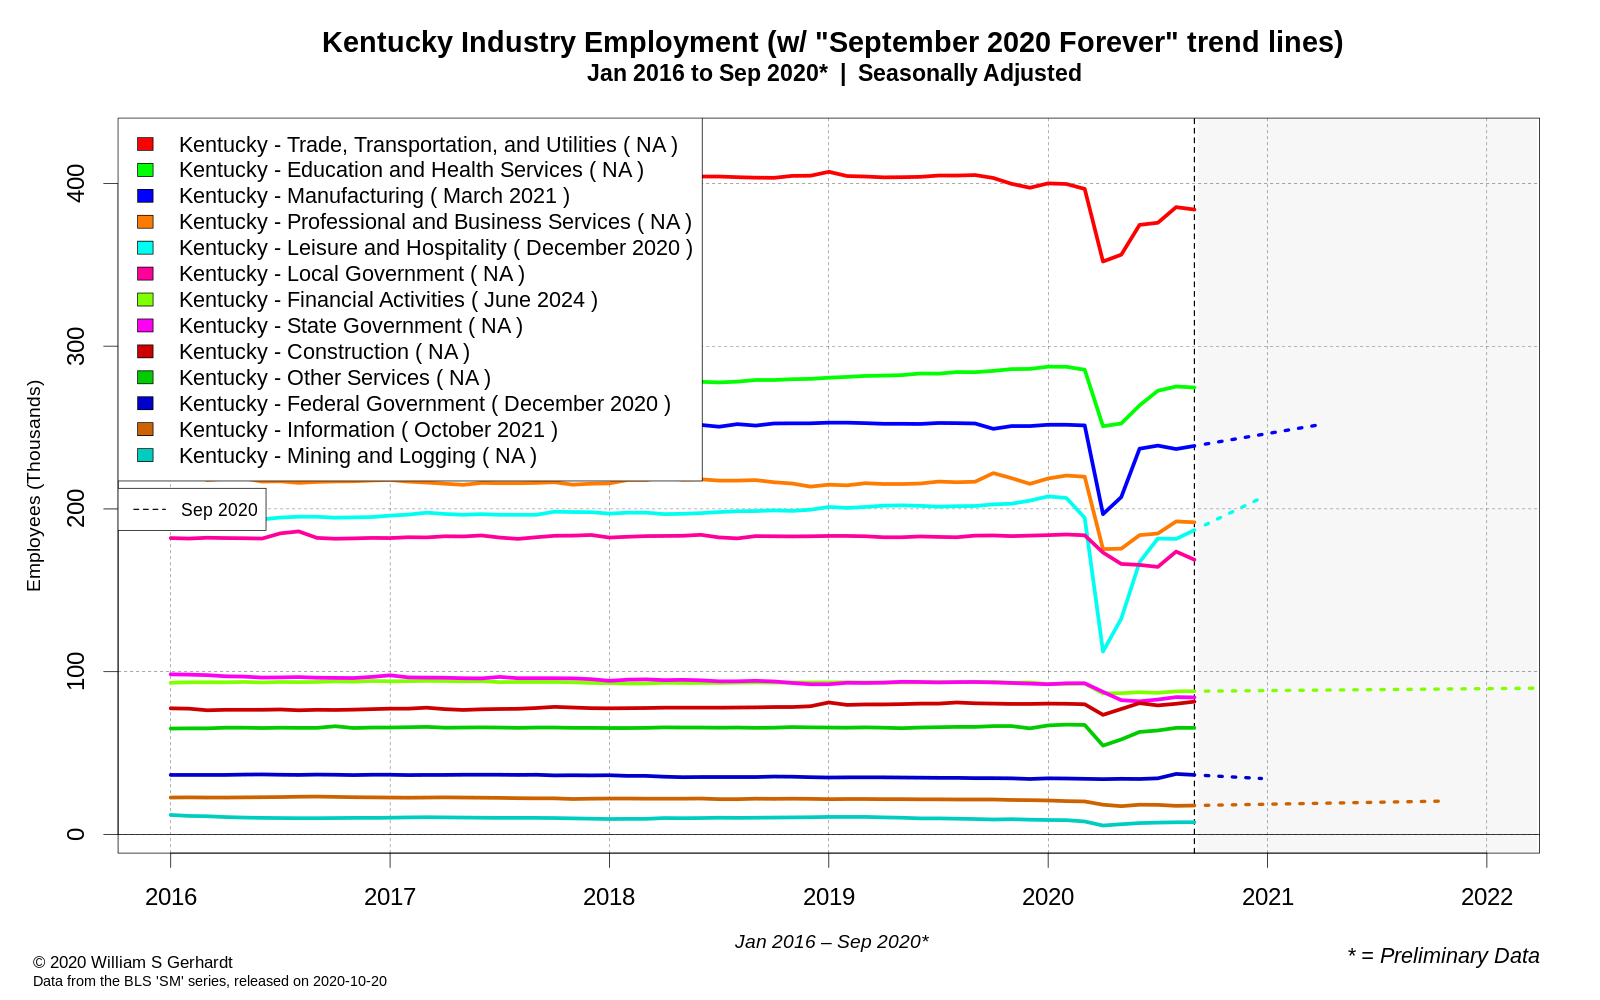
While the construction industry has fully returned to February 2020 employment levels many major industries in Kentucky have stalled out or are now shrinking. The clear exception, however, is the Leisure and Hospitality Industry, which is currently on the speedy path to full employment in Kentucky. The Leisure and Hospitality Industry includes the “Arts, Entertainment, and Recreation” sector, which in Kentucky gained a brisk 4% in seasonally adjusted employment in September, and was on-track to return to February 2020 employment levels this month (October 2020). Will it recover? Come back here on or around November 20, 2020 for the preliminary answer.